Table of contents
Objectives
Derivatives
- Definition
- Interpretation
Derivatives
Differentiation is a process of taking derivative.
The derivative of with respect to x is the function :
View more about the origin of the term
Origin of Differentiation terminologies
The following information are just opinions originated by Math SE, Quora, and Wikipedia:
- Derivative implies a derived function of the original , the final product which is obtained from the Differentiation of the same function.
- Differentiate could refers to the the word ‘difference’ as Leibniz studied finite differences and introduce (infinitesimal) differentials.
- Differential means a mathematical expression using differentials (e.g. )
There are 2 major interpretations for a derivative of a function:
- Rate of change
- Slope of tangent line
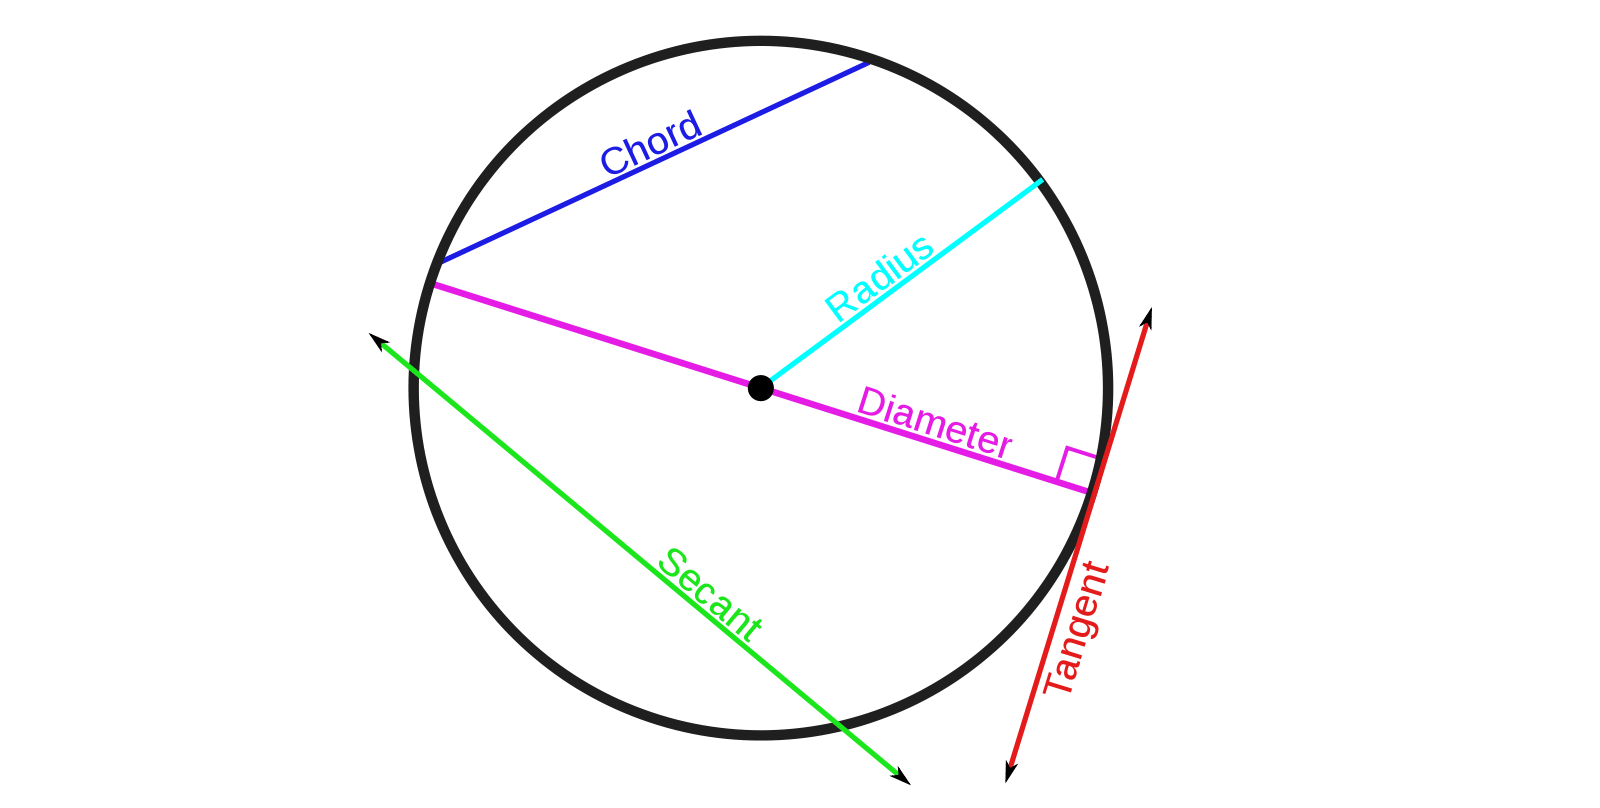 Figure 1: Common lines and line segments on a circle (Wikipedia: Secant Line, 2021)
To understand a tangent line, the secant line concept has to come first.
A secant is a line that intersects a curve at a minimum of two distinct points.
Then,
A tangent line is a line that intersects a curve at two infinitely close points
― Gottfried Wilhelm Leibniz
If we draw a secant line at , the slope of this line is:
This equation forms a difference quotient. Suppose , the aforementioned equation can also be expressed as:
Also, from the above properties, one could infer the slope of the tangent line of at is:
To summary,
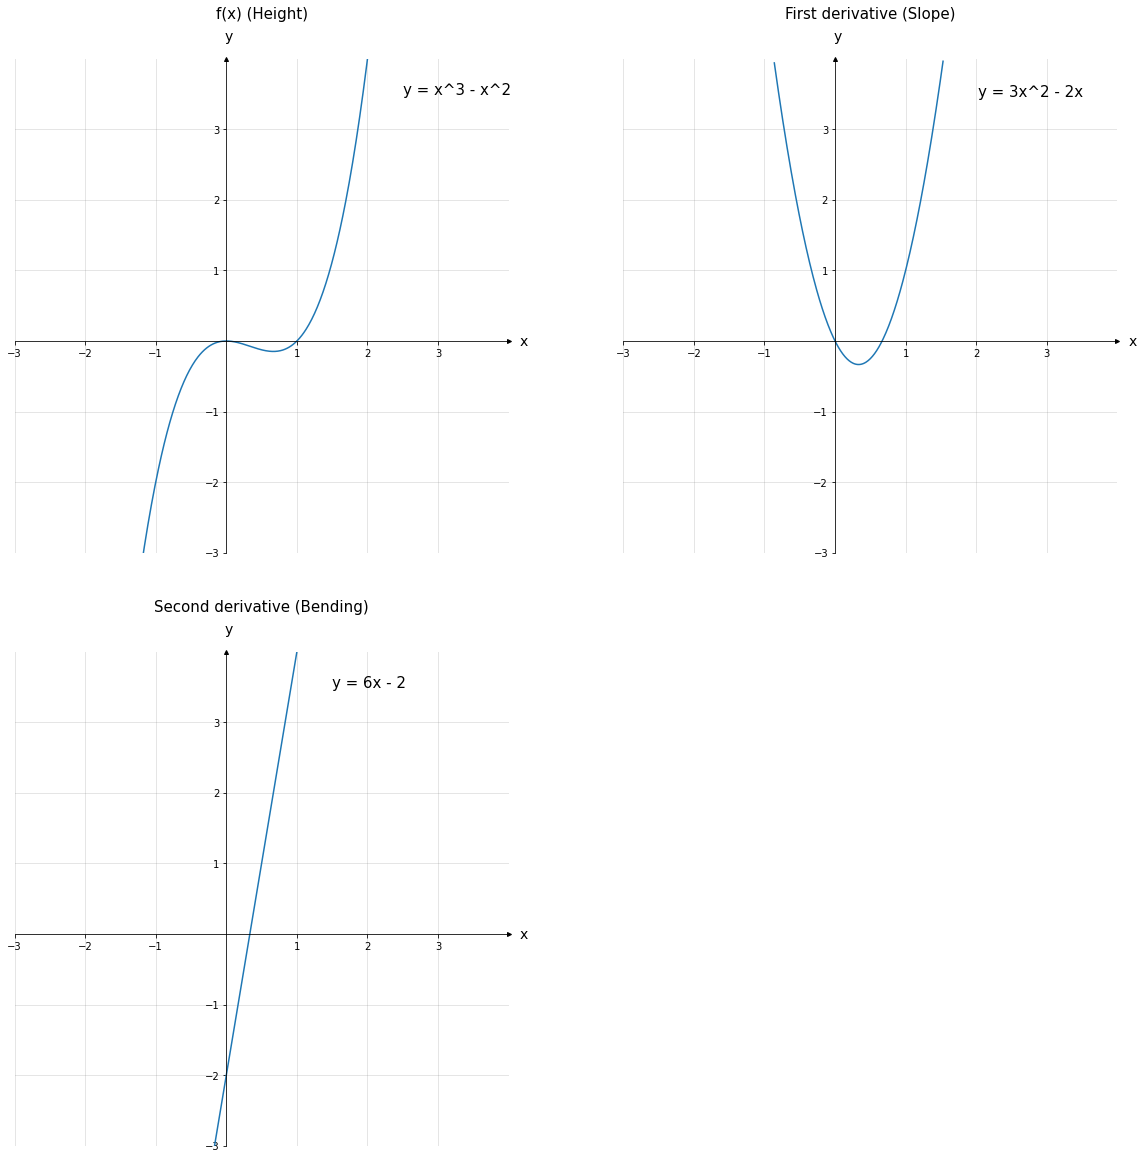 Figure 2: Examples of derivatives
Code for Fig. 2
import warnings
warnings.filterwarnings('ignore')
import logging
logging.basicConfig(
    format='%(asctime)s %(levelname)-8s %(message)s',
    level=logging.INFO,
    datefmt='%Y-%m-%d %H:%M:%S')

import tensorflow as tf
from matplotlib import pyplot as plt
import numpy as np

class CartesCoordinator:
  """
    Collection of utils for vector operation samples and exercise
  """
  def draw_coord(ax, xlim=(-5,5), ylim=(-5,5), tick_freq=1, aspect=1):
    xmin, xmax = xlim
    ymin, ymax = ylim

    ax.set(xlim=(xmin, xmax + tick_freq), ylim=(ymin, ymax + tick_freq), aspect=aspect)

    # Employ bottom, left spines as x,y axes
    ax.spines['bottom'].set_position('zero')
    ax.spines['left'].set_position('zero')

    # Remove top, right spines
    ax.spines['top'].set_visible(False)
    ax.spines['right'].set_visible(False)

    # Set x,y label on axes
    ax.set_xlabel('x', size=14, labelpad=-24, x=1.03)
    ax.set_ylabel('y', size=14, labelpad=-24, y=1.03, rotation=0)

    x_ticks = np.arange(xmin, xmax+tick_freq, tick_freq)
    y_ticks = np.arange(ymin, ymax+tick_freq, tick_freq)

    # Draw major and minor grid lines
    ax.grid(which='both', color='grey', linewidth=1, linestyle='-', alpha=0.2)

    ax.set_xticks(x_ticks[x_ticks != 0])
    ax.set_yticks(y_ticks[y_ticks != 0])

    # Arrows for axes
    arrow_fmt = dict(markersize=4, color='black', clip_on=False)
    ax.plot(1, 0, marker='>', transform=ax.get_yaxis_transform(),**arrow_fmt)
    ax.plot(0, 1, marker='^', transform=ax.get_xaxis_transform(),**arrow_fmt)

class DerivativeVisualization:
  def draw_f(ax, f, func_name, x_lim, y_lim, delta=0.01, X_in=None, alpha=1, tick_freq=1):
    X = X_in if (X_in is not None) else tf.range(x_lim[0] - delta, x_lim[1] + delta, delta=delta)

    X = tf.boolean_mask(X, tf.less(f(X), y_lim[1] + tick_freq))
    Y = f(X)

    # Draw f(x)
    ax.plot(X, Y, '-', alpha=alpha)
    ax.text(X[-1] + 0.5, Y[-1] - 0.5, func_name, fontsize=15)
from matplotlib import ticker

tf.random.set_seed(32)

x_domain = (-3, 3)
y_domain = (-3, 3)
fig, ax = plt.subplots(2, 2,figsize=(20,20))

### f(x)
f = lambda x: (x**3 - x**2)

ax[0,0].set_title('f(x) (Height)', pad=40, size=15)
CartesCoordinator.draw_coord(ax[0,0], x_domain, y_domain, aspect=1)
DerivativeVisualization.draw_f(ax[0,0], f, 'y = x^3 - x^2', x_domain, y_domain)

### f'(x)
f = lambda x: (3*x**2 - 2*x)

ax[0,1].set_title('First derivative (Slope)', pad=40, size=15)
CartesCoordinator.draw_coord(ax[0,1], x_domain, y_domain, aspect=1)
DerivativeVisualization.draw_f(ax[0,1], f, 'y = 3x^2 - 2x', x_domain, y_domain)

### f''(x)
f = lambda x: (6*x - 2)

ax[1,0].set_title('Second derivative (Bending)', pad=40, size=15)
CartesCoordinator.draw_coord(ax[1,0], x_domain, y_domain, aspect=1)
DerivativeVisualization.draw_f(ax[1,0], f, 'y = 6x - 2', x_domain, y_domain)

fig.delaxes(ax[1,1])

plt.show()
References
- Wikipedia: Secant line. (2021). https://en.wikipedia.org/wiki/Secant_line[Online; accessed 2021-07-28]