Differentiation Formulas
Table of contents
Objectives
Differentiation Formulas
- Trig functions
- Exponential functions
- Logarithm functions
- Hyperbolic functions
Trig Functions
WIP
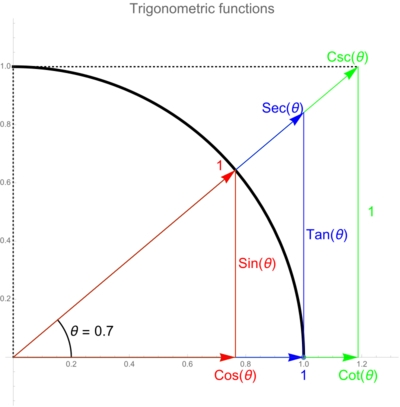
Below are popular six trig functions:
More reviews could be found here

Figure 3: Trigonometric functions (Wikipedia: Trigonometric Functions, 2021)
| Function | Derivative | |
|---|---|---|
| sin | ||
| cos | ||
| tan | ||
| cot |
Exponential functions
Number e
WIP
The number is an important mathematical constant, approximately equal to .
Three general definitions of are:
Eucler’s Number: Intuitions
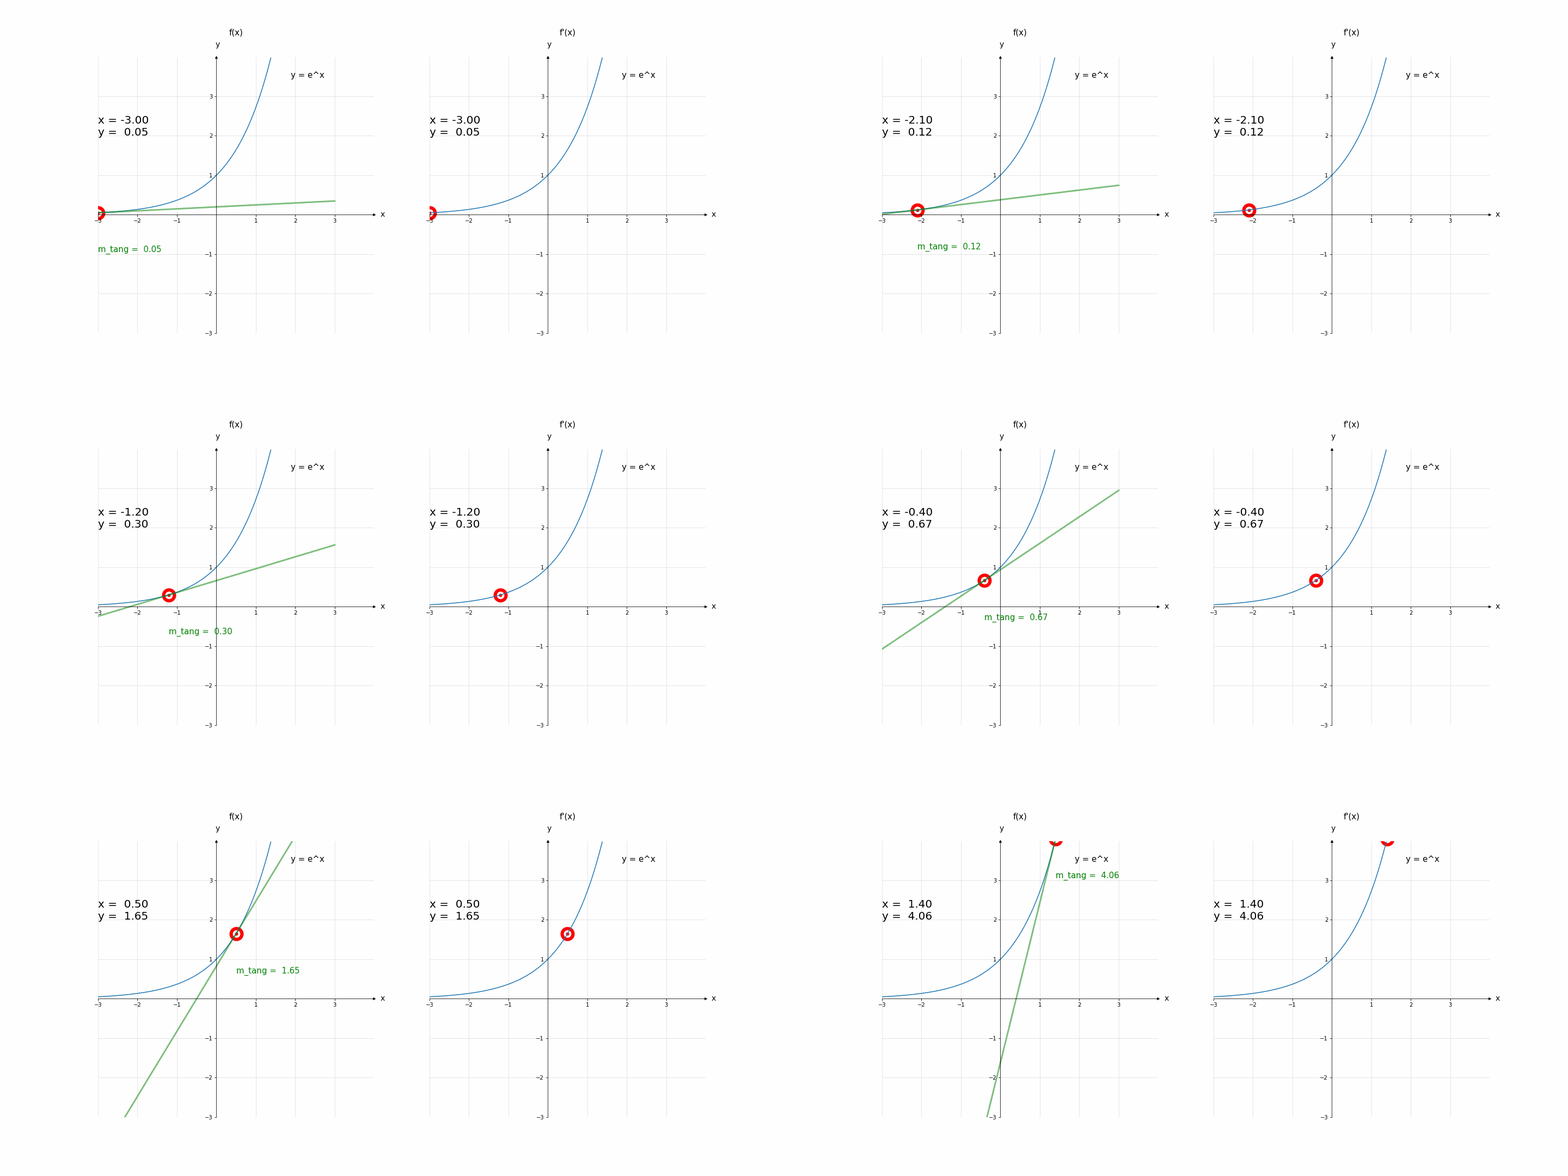
Code for Fig. 2
import warnings
warnings.filterwarnings('ignore')
import logging
logging.basicConfig(
    format='%(asctime)s %(levelname)-8s %(message)s',
    level=logging.INFO,
    datefmt='%Y-%m-%d %H:%M:%S')

import tensorflow as tf
from matplotlib import pyplot as plt
import numpy as np

class CartesCoordinator:
  """
    Collection of utils for vector operation samples and exercise
  """
  def draw_coord(ax, xlim=(-5,5), ylim=(-5,5), tick_freq=1, aspect=1):
    xmin, xmax = xlim
    ymin, ymax = ylim

    ax.set(xlim=(xmin, xmax + tick_freq), ylim=(ymin, ymax + tick_freq), aspect=aspect)

    # Employ bottom, left spines as x,y axes
    ax.spines['bottom'].set_position('zero')
    ax.spines['left'].set_position('zero')

    # Remove top, right spines
    ax.spines['top'].set_visible(False)
    ax.spines['right'].set_visible(False)

    # Set x,y label on axes
    ax.set_xlabel('x', size=14, labelpad=-24, x=1.03)
    ax.set_ylabel('y', size=14, labelpad=-24, y=1.03, rotation=0)

    x_ticks = np.arange(xmin, xmax+tick_freq, tick_freq)
    y_ticks = np.arange(ymin, ymax+tick_freq, tick_freq)

    # Draw major and minor grid lines
    ax.grid(which='both', color='grey', linewidth=1, linestyle='-', alpha=0.2)

    ax.set_xticks(x_ticks[x_ticks != 0])
    ax.set_yticks(y_ticks[y_ticks != 0])

    # Arrows for axes
    arrow_fmt = dict(markersize=4, color='black', clip_on=False)
    ax.plot(1, 0, marker='>', transform=ax.get_yaxis_transform(),**arrow_fmt)
    ax.plot(0, 1, marker='^', transform=ax.get_xaxis_transform(),**arrow_fmt)

class DerivativeVisualization:
  def draw_f(ax, f, func_name, x_lim, y_lim, delta=0.01, X_in=None, alpha=1, tick_freq=1):
    X = X_in if (X_in is not None) else tf.range(x_lim[0] - delta, x_lim[1] + delta, delta=delta)

    X = tf.boolean_mask(X, tf.less(f(X), y_lim[1] + tick_freq))
    Y = f(X)

    # Draw f(x)
    ax.plot(X, Y, '-', alpha=alpha)
    ax.text(X[-1] + 0.5, Y[-1] - 0.5, func_name, fontsize=15)
from matplotlib import ticker

tf.random.set_seed(32)

x_domain = (-3, 3)
y_domain = (-3, 3)
fig, ax = plt.subplots(1, 2,figsize=(20,20))

### f(x)
f = lambda x: (np.e ** x)

ax[0].set_title('f(x)', pad=40, size=15)
CartesCoordinator.draw_coord(ax[0], x_domain, y_domain, aspect=1)
DerivativeVisualization.draw_f(ax[0], f, 'y = e^x', x_domain, y_domain)

### f'(x)
f = lambda x: (np.e**x)

ax[1].set_title('f\'(x)', pad=40, size=15)
CartesCoordinator.draw_coord(ax[1], x_domain, y_domain, aspect=1)
DerivativeVisualization.draw_f(ax[1], f, 'y = e^x', x_domain, y_domain)

plt.show()
import numpy as np
from IPython.display import HTML, Image
from matplotlib import animation, rc

rc('animation', html='html5')

tf.random.set_seed(32)

x_domain = (-3, 3)
y_domain = (-3, 3)
fig, ax = plt.subplots(1, 2, figsize=(20,10))

### f(x)
f = lambda x: (np.e ** x)

ax[0].set_title('f(x)', pad=40, size=15)
CartesCoordinator.draw_coord(ax[0], x_domain, y_domain, aspect=1)
DerivativeVisualization.draw_f(ax[0], f, 'y = e^x', x_domain, y_domain)

### f'(x)
f_prime = lambda x: (np.e**x)

ax[1].set_title('f\'(x)', pad=40, size=15)
CartesCoordinator.draw_coord(ax[1], x_domain, y_domain, aspect=1)
DerivativeVisualization.draw_f(ax[1], f_prime, 'y = e^x', x_domain, y_domain)

class AnimatedDerivative(object):
  """An animated changes in a function and its derivative function"""

  def __init__(self, fig, ax, f, f_prime, numpoints=50):
    self.scat = []
    self.texts = []

    self.f = f
    self.f_prime = f_prime

    self.fig, self.ax = fig, ax
    self.ani = animation.FuncAnimation(self.fig,
                                       self.animate,
                                       interval=500,
                                       init_func=self.setup_plot,
                                       frames=45,
                                       blit=True)

  def compute_slope(x, f):
    eps = 0.0001
    return (f(x+eps)-f(x))/eps

  def draw_tangent(x, f):
    k = AnimatedDerivative.compute_slope(x, f)
    X = np.linspace(-3, 3, 1000)
    Y = k*X + (f(x) - k*x)

    return X, Y

  def setup_plot(self):
    """Initial drawing"""
    self.texts.append(self.ax[0].text(-3, 2, f'',fontsize=20))
    self.texts.append(self.ax[1].text(-3, 2, f'',fontsize=20))

    self.scat.append(self.ax[0].scatter([], [], color='red', linewidths=20))
    self.scat.append(self.ax[1].scatter([], [], color='red', linewidths=20))

    self.tang, = self.ax[0].plot([], [], alpha=0.5, color='green', linewidth=3)
    self.m_tang = ax[0].text(-3, self.f(-3) - 1, '', fontsize=15, color='green')

    return self.texts + self.scat + [self.tang, self.m_tang]

  def animate(self, i):
    x = -3 + 0.1*i
    k = AnimatedDerivative.compute_slope(x, f)

    self.texts[0].set_text(f'x = {x: 4.2f}\ny = {self.f(x): 4.2f}')
    self.texts[1].set_text(f'x = {x: 4.2f}\ny = {self.f_prime(x): 4.2f}')

    self.scat[0].set_offsets([x, f(x)])
    self.scat[1].set_offsets([x, f_prime(x)])

    X, Y = AnimatedDerivative.draw_tangent(x, self.f)
    self.tang.set_data(X, Y)
    self.m_tang.set_text(f'm_tang = {k: 4.2f}')
    self.m_tang.set_position((x, f(x)-1))

    return self.texts + self.scat + [self.tang, self.m_tang]

plt.close()
a = AnimatedDerivative(fig, ax, f, f_prime)
a.ani.save('/content/drive/MyDrive/ML/calculus/sample.gif', writer='pillow')

Image(open('/content/drive/MyDrive/ML/calculus/sample.gif', 'rb').read())
Inverse of Trig functions
Inverse Sine
View proof
Inverse of Sine Proof
Suppose that
We have:
Let then:
Secondly, we also have
From we could conclude that:
Summary: Inverse trig functions
References
- Wikipedia: Trigonometric functions. (2021). https://en.wikipedia.org/wiki/Trigonometric_functions[Online; accessed 2021-07-28]